

IoT Water level monitoring with Watmonitor webapp
For households, industry, IoT enthusiasts
Watmonitor - IoT level monitoring dashboard
Watmonitor is a centralized web application for visualizing the level of liquids and bulk materials. It allows connecting sensor nodes via API and storing data in a database. Thanks to the intuitive interface, you can monitor the current level and volume in real time, including trends (rise, fall) and connection status.
Key features
- Real-time tank level and volume values with measurement trends
- Advanced visualizations – graphs with measurement history
- Data export from graphs in .svg, .png, .csv formats
- Maximum and minimum level values for periods
- Support for differential and total level measurements
- Responsive design – usable on both PC and smartphone
- Possibility of integration via JSON endpoints into other systems
The solution is designed to monitor liquids - water, oil, fuel, bulk materials such as biomass, pellets, seed, ballast, sand, granulates and other materials.
Usage Scenarios
An ideal solution to store, archive and visualise liquid level in wells, retention tanks, IBC containers, shafts, lakes, cesspools or bulk material height in silos, hoppers, bunkers, silos, stockpiles.
Supported Sensor Types
The web interface is universal – it does not distinguish from which sensor it obtains data. Any sensor for which you customize the firmware is supported. For a ready-made industrial sensor solution, just set up a callback to the Watmonitor API for data logging, visit FAQ.
Fast Prototyping
For rapid prototyping with Watmonitor, source codes for DIY open-source hardware are available: ESP32, ESP8266, Arduino, Rpi Pico W. WiFi / Ethernet connectivity with ultrasonic or ToF laser sensors. Support for Low Power mode, OTA updates. Arduino Core / MicroPython / ESP-IDF with FreeRTOS. Experimental implementations - Bluetooth Low Energy (BLE), LoRa, LoRaWAN.
QR / AR Features
Watmonitor is compatible with supporting web applications that allow visualization of the latest data. Simply scan the QR code with your mobile phone. The data can be displayed in the form of a static visualization, or in Camera-relative augmented reality (AR scene). Another option is to use an NFC card (NTAG) or RFID card to trigger the AR visualization. It uses Watmonitor's JSON endpoint to obtain data.

Affordable
On-premise
Downloadable graphs
Open-source HW friendly
Responsive
Multilanguage support
White labeling
Support & feedback
Details

The root (Overview) page
The main overview of actual state of Watmonitor's sensor node data, connectivity
Watmonitor's main page displays real-time water level data, volume, and trends (increase/decrease). It also shows the time of recording and sensor node connectivity status, providing users with up-to-date information for effective water monitoring.

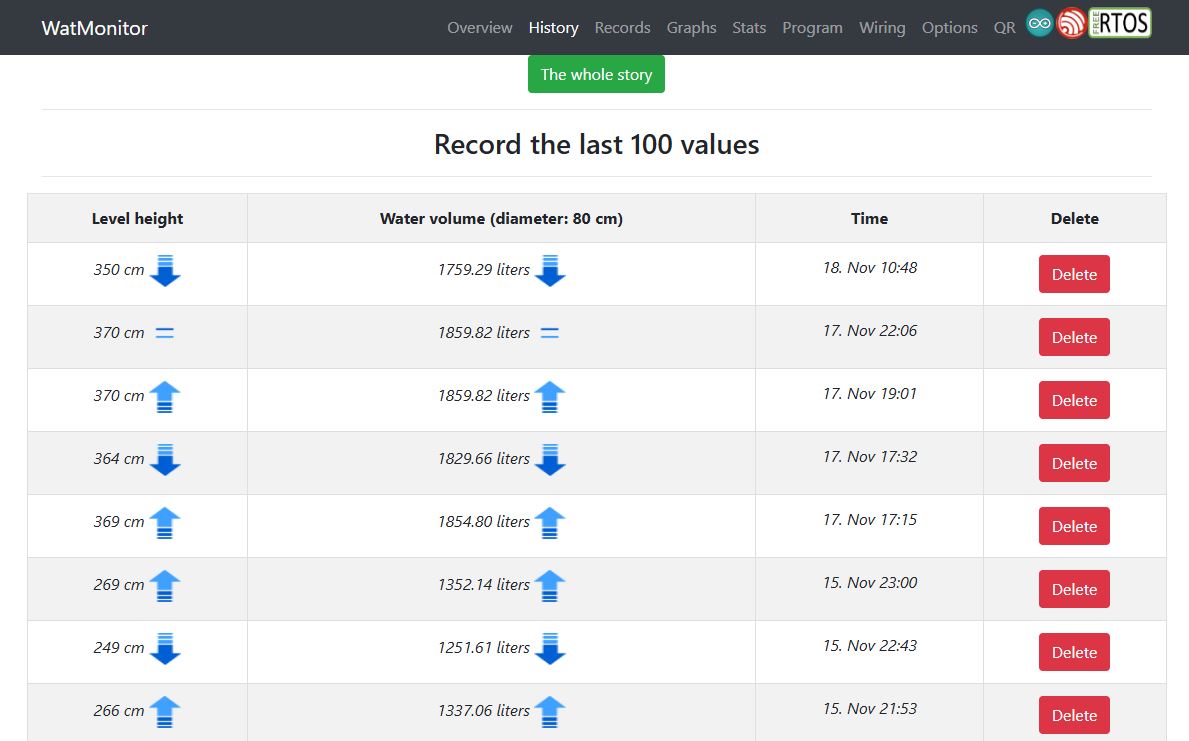
History & Records pages
Whole data history, min / max recordings for set period of time
The History page in Watmonitor displays all water level measurements in a table format, with the option to delete any record. The Records page shows the minimum and maximum water levels for the last 24 hours, 7 days, and 30 days, presented in a gauge visualization for easy monitoring.

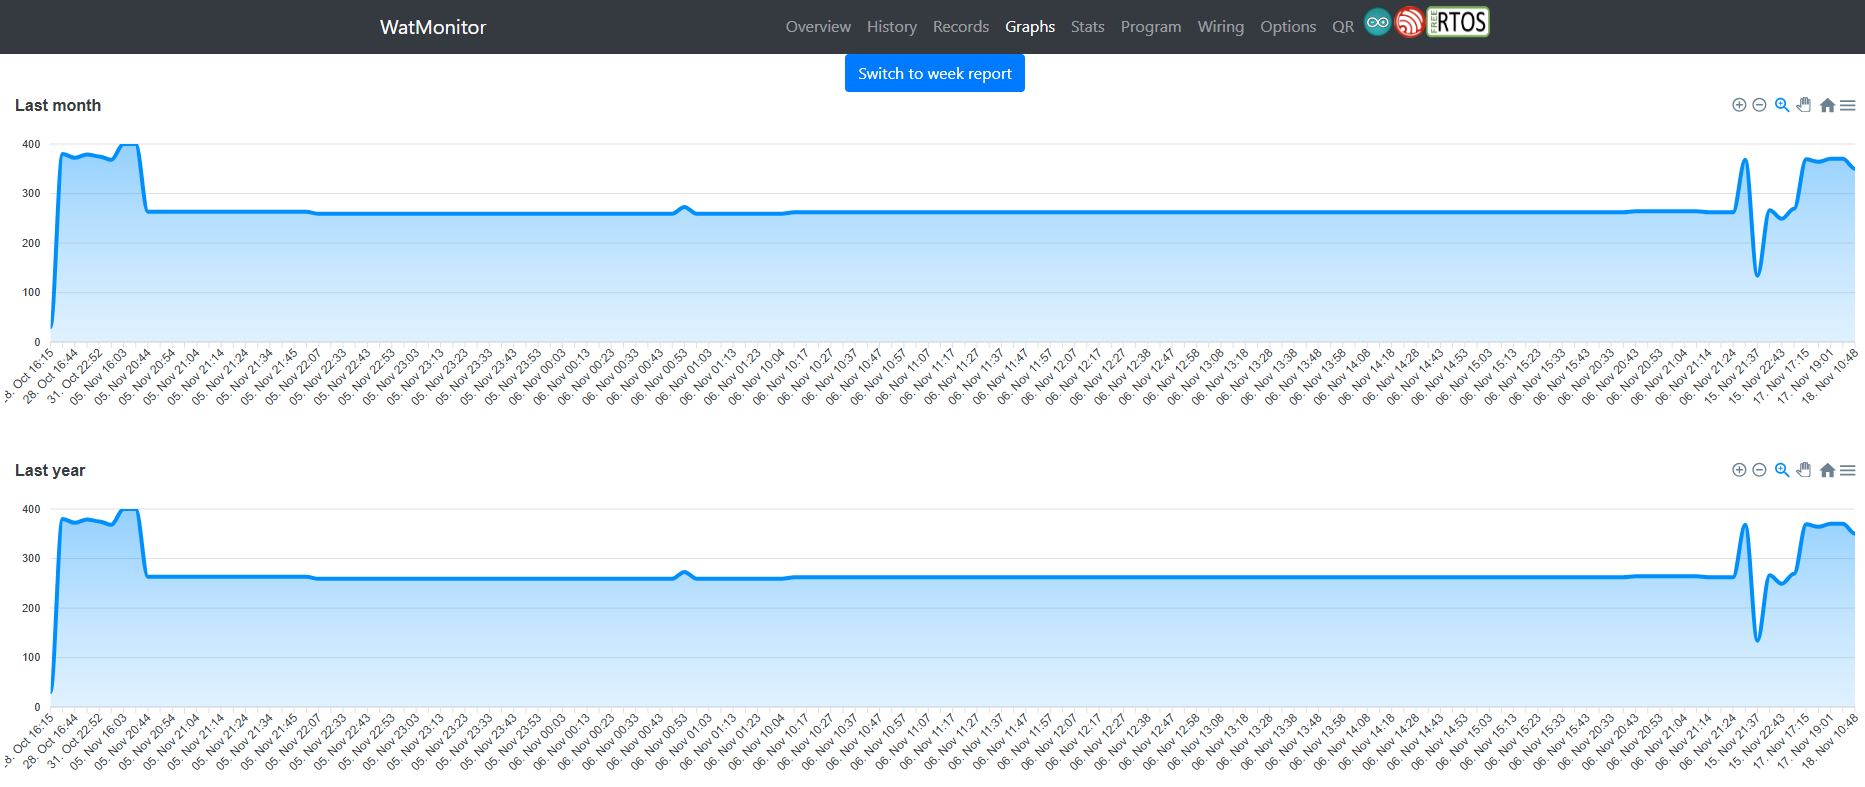
Line Area Graphs
Overview of water level data in different time series, up to 1 year ago.
Watmonitor's Graph page allows users to easily view and analyze time-series water level data. Users can download the entire graph or specific sections and export the data in multiple formats, including .csv, .png, and .svg, for further analysis and reporting (MATLAB, OriginLab, Excel, PowerPoint, AI).
 microcontroller with WiFi or PHY Ethernet connection method to the Watmonitor's interface via HTTP or HTTPS")
ESP32 program
Automatically-generated source code for ESP32 (Arduino IDE)
The Program page offers pre-configured ESP32 source codes for IoT sensor nodes with Wi-Fi and ULP mode support. It works with ultrasonic (JSN-SR04T, HC-SR04) or ToF laser (VL53L1X) sensors.
All routes to your Watmonitor instance are automatically configured. Source code is configured based on used protocol when viewing (HTTPS for secured connection, or HTTP for testing, localhost instance). The code is Arduino Core 3.X.X compatible for quick and seamless hardware integration.

Wiring diagram
Wiring diagrams for all supported open-source hardware
The wiring diagrams available on this page are designed for open-source hardware platforms such as ESP32, ESP8266, and Arduino, with program implementations available on GitHub. Simplified pin-mapping tables are also provided to help non-technical users easily set up the hardware for their water monitoring system.

Options
Options to set waterwell dimensions, language
This page allows users to input water well dimensions (depth and diameter) to calculate the total water level and volume of the well. The page supports multiple language options, including English, Slovak, German, Russian, French, Polish and Spanish, making it accessible to a wide range of users.

Interconnect PCB
Rapid prototyping with off-the-shelf hardware
Interconnect PCBs allow the use of ready-made WiFi devkits such as Lolin32 (ESP32-WROOM-32) or XIAO Seeed Studio devkits (ESP32-S3, ESP32-C6, ESP32-C3). Possibility to power boards using Li-pol or Li-Ion battery with possibility of charging via 5V solar panel or USB cable. Support for LoRa RA-02 module (433 MHz). 4-pin interface allows connection of ultrasonic sensors HC-SR04 or JSN-SR04T, or ToF laser sensors VL53L1X or VL53L0X, or your own sensor (digital GPIO, I2C bus ) or also extra sensors such as DS18B20 on OneWire bus which can be used for temperature-compensated readings. Hardware can be soldered directly to the PCB, or mounted in pin headers for easier replacement without the need for soldering in the future.
Gallery


Frequently Asked Questions
The most asked question from the community answered below
Do I need web hosting to run Watmonitor on my own server?
Yes, to run Watmonitor, you will need either local or internet web hosting. In order to execute the PHP scripts for Watmonitor, your server must have Apache (HTTPD) or NGINX service installed. Watmonitor has been tested and works on PHP versions 7 to 8.4. For database MySQL or MariaDB is required.
Is it difficult to configure the web application for Watmonitor?
Configuring the web application for Watmonitor is made easy with a detailed, step-by-step guide in PDF format. This guide simplifies the setup process for all users, including instructions for importing the .sql file into MySQL, configuring connect.php with your database credentials, setting up HTTP Auth data, and entering the device token.
Will Watmonitor automatically generate source code for my hardware?
Yes, Watmonitor will automatically generate source code sketches for ESP32 with WiFi and ULP and supported ultrasonic or ToF laser sensors. The generated sketches will include the necessary MCU token, calculate the trace to the target PHP file, and automatically add your domain (note: localhost will not work—ensure you use an accessible IP or domain name). The Root CA certificate (for HTTPS connections) is not modified, so you will need to manually add it into the sketch for the ESP32, default used is Let's Encrypt Root CA certificate ISRG Root X1.
Are there additional source codes available beyond those in the Watmonitor app?
Yes, there are several additional source codes available on GitHub that are compatible with the Watmonitor interface. These include examples for Arduino with Ethernet (ENC or Wiznet series), ESP8266, ESP32, and other transmission technologies such as LoRaWAN and Sigfox LPWAN. You can access these source codes by clicking the "Sensor node examples" button at the top of this page.
In what languages is Watmonitor available?
The Watmonitor web app offers full language translations for the following languages: English, German, Russian, Spanish, French, and Slovak, making it accessible to a global audience.
How to integrate Watmonitor into other systems?
Watmonitor has two JSON API endpoints - accessible via HTTP GET:
• json_output.php – provides the latest known data (natively used by QR scanner / AR visualization).
• json_output2.php – provides all recorded data with the option to enter GET parameters to limit the results (from–to), or all from, or all to.
Endpoints allow integration into other automation-enabled systems:
Node-RED, Ignition SCADA, NetSuite, AWS IoT Core, ThingsBoard, Grafana, ELK Stack, Power BI, Tableau, Home Assistant...
Extendable with webhooks for automation (Kafka, IFTTT, n8n, Microsoft Power Automate), or AI.
How is Communication Established Between the Server and Sensor Node?
The sensor node communicates with the webserver via HTTP or HTTPS. At regular intervals (e.g., every 5 minutes), it measures the water level and sends it using a POST request. The server stores the data in a MySQL database, allowing visualization of water levels through the Watmonitor web application and reliable monitoring of trends.
How Does the IoT Sensor Node Perform Measurement?
The IoT sensor node, measures distance using the Time-of-Flight (ToF) principle. With an ultrasonic sensor, it sends a short trigger pulse and measures the time for the echo to return. With a laser ToF sensor, it emits light pulses and calculates distance from the reflected signal’s travel time. Both methods deliver comparable measurements suitable for IoT applications.
What does the callback look like on Watmonitor?
To send data to Watmonitor, make an HTTP POST request to the host's
data.php file (e.g.,
https://hladinomer.eu/data.php)
using port 80 or 443. Include two parameters:
hodnota (water level difference in cm, INT) and
token (authorization).
The request must include the header
Content-Type: application/x-www-form-urlencoded.
A successful write returns an HTTP 200 response with OK.
Can I simulate sensor node without a physical hardware?
Yes, it is possible! There are examples available on Wokwi simulator that allows you to send data to Watmonitor interface each 5 mins via simulated sensor node and HC-SR04 ultrasonic sensor (possible to adjust distance reading).
• RPi Pico W (MicroPython)
• RPi Pico W (Arduino Core)
• RPi Pico W (Pico SDK C)
• ESP32 (MicroPython)
• ESP32 (Arduino Core)
• ESP32 (ESP-IDF v5.3+, FreeRTOS, xQueue)
